Setting up server monitoring, then throwing it away

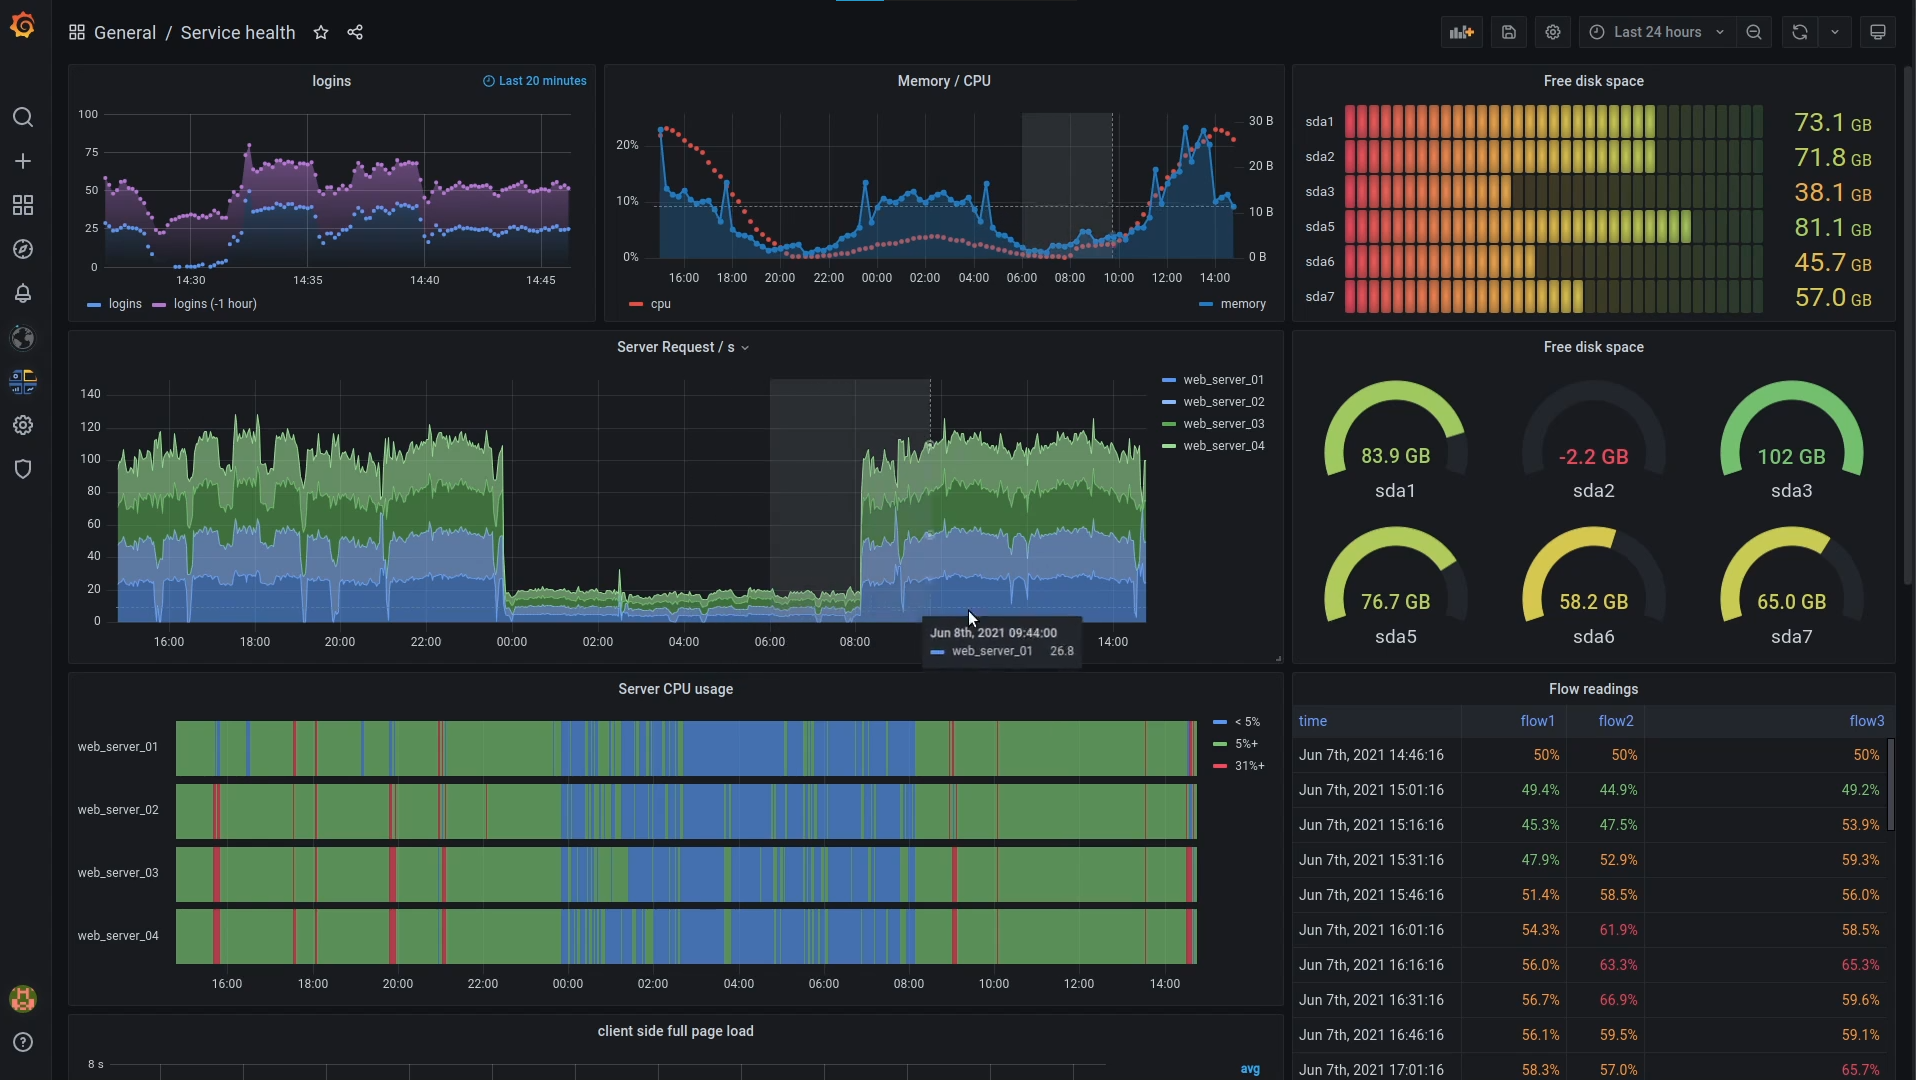
If you spend any time around places where folks talk about self-hosting, you've probably seen at least two things in abundance: screenshots of server dashboards, and screenshots of groups of cool-looking charts. The latter ones often are taken from monitoring software of some sort. They look impressive and suggest serious business. Just look at this dash taken from Grafana's web!
However, I never felt like setting something like that up. At my scale and for my use-cases, it seemed completely unnecessary. I also would've bet it's difficult to set it up like that.
That changed when my main server started having issues. Basically every other day something overloaded it, I couldn't even connect, and only a restart would help.
So I thought - right. Let's give this a try, preferably without wasting too much time.
NetData
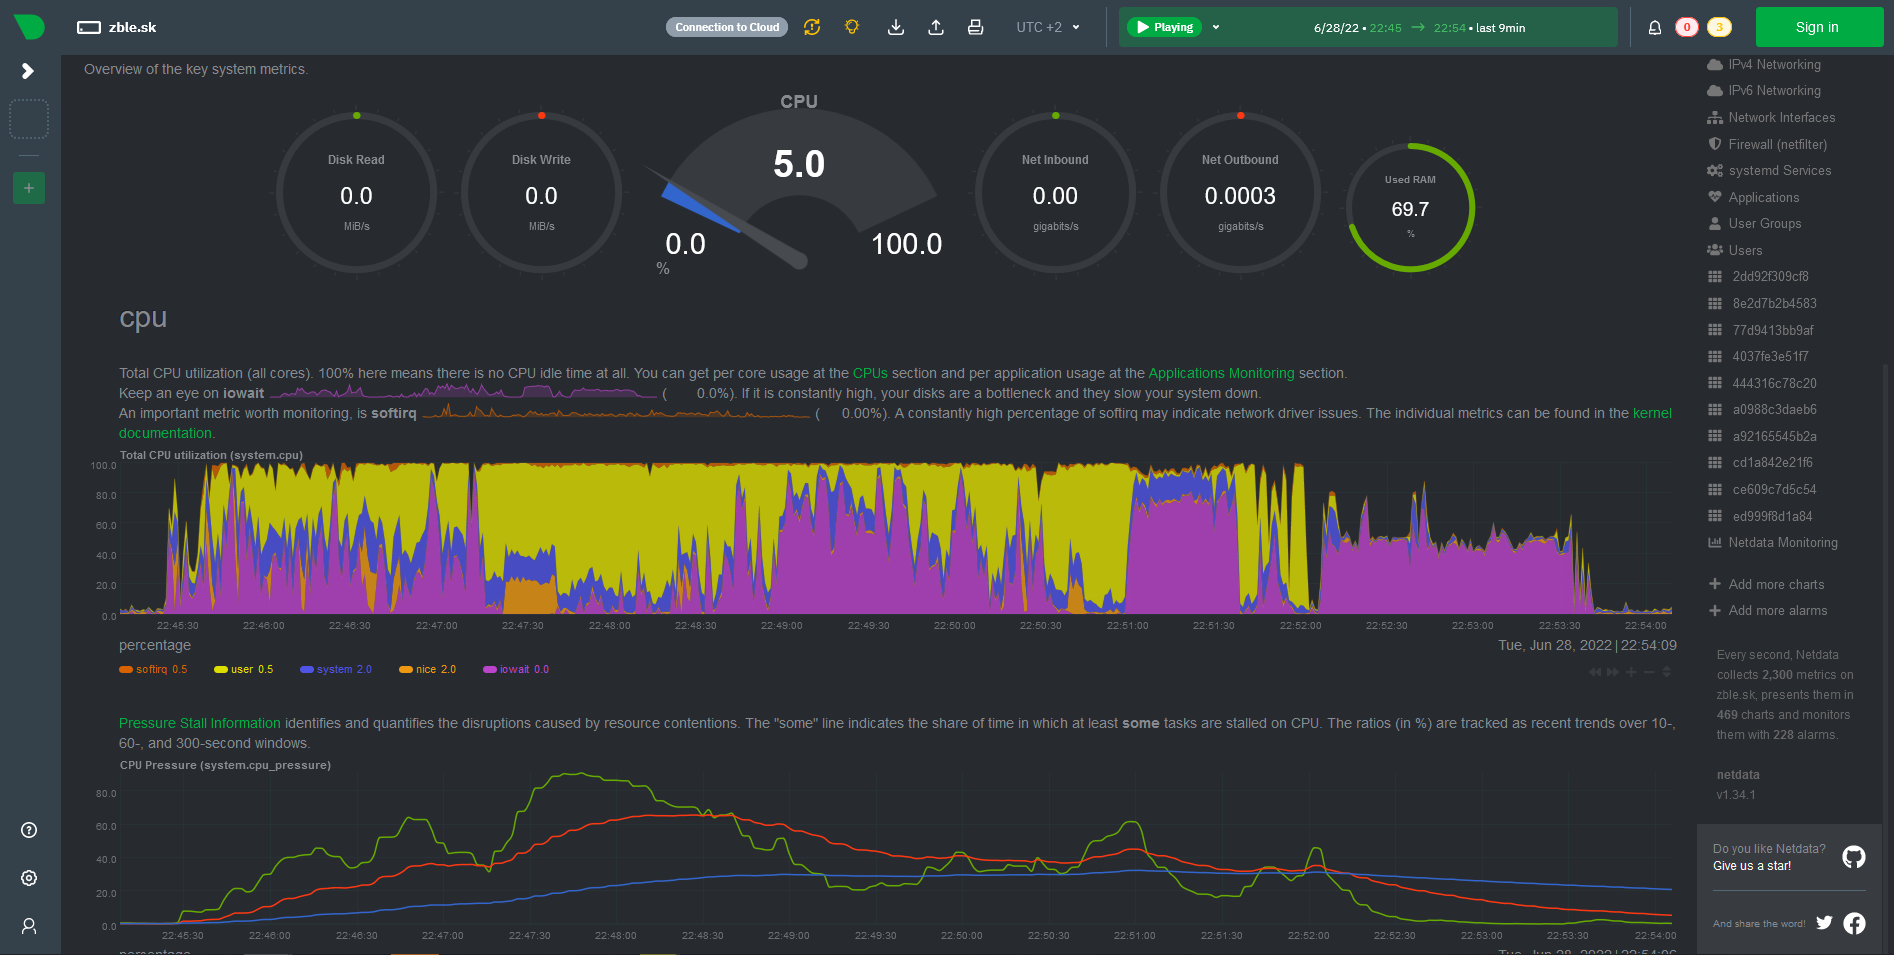
I have heard about NetData before, so I went and tried it.
I have to say, the first impression was beyond good. It was easy to set up with docker and immediately showed a dashboard of the system's stats over HTTP. Since I have the server on Tailscale VPN, I could immediately access that dashboard securely.
That might help a bit if I'm looking in the stats in the exact moment things start going wrong. After all, if the monitoring endpoint goes down with the server, I can't see a thing.
Prometheus & Grafana
To solve that, I used other two popular components: Prometheus for collecting the data from NetData.
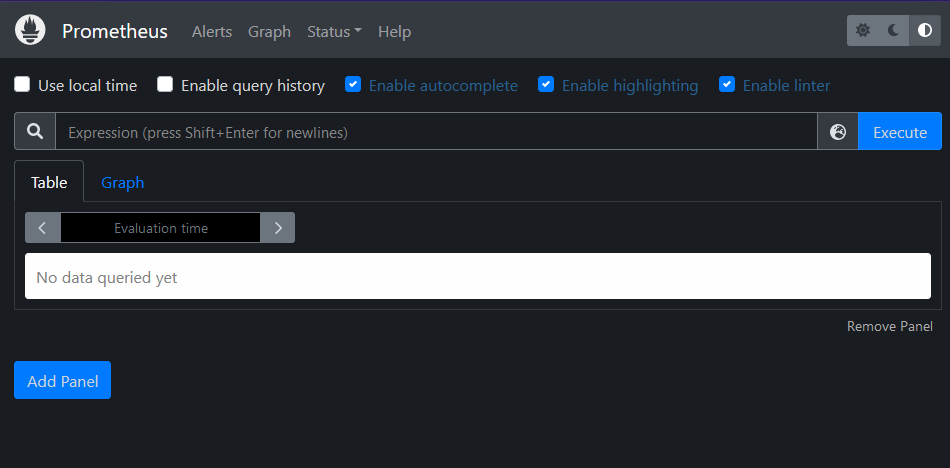
Then Grafana to take data from Prometheus and visualize them.
Both of those took a lot longer to get up and running. I had issues starting them up in Docker, and getting them to talk to each other.
Success?
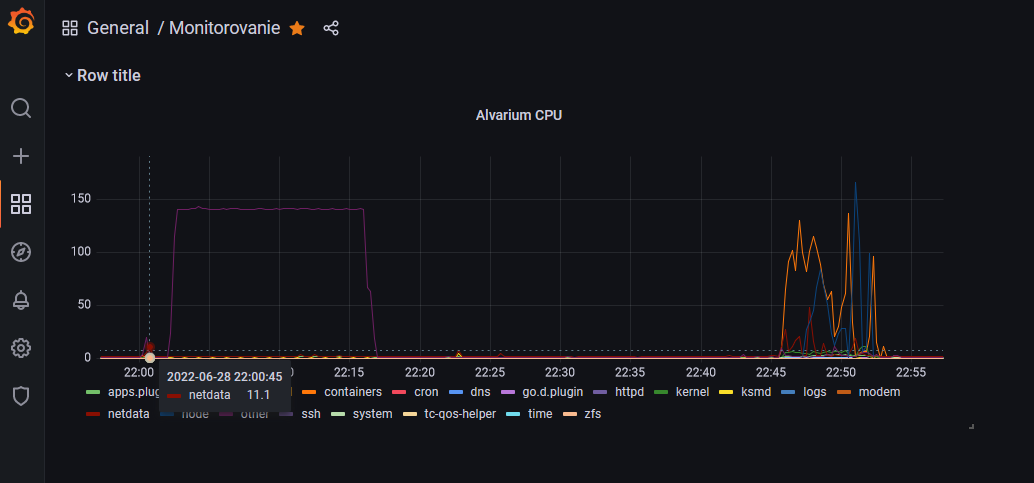
When the data started flowing as it was supposed to, I had to set up the dashboard in Grafana. That is - take all the NetData inputs and display them in a helpful manner. This is the part I thought would be time-consuming and/or difficult.
I just set up a few basic metrics and called it a day; I've spent far too much on this anyway.
This stack then helped confirm my suspicions that my config changes to Huginn (which I just love; wrote about it here and here) were the culprit. Sometimes, the worker threads would cause a massive spike in disk reads and CPU usage, which brought the server to a screeching halt.
Success, right?
Ditching the entire thing
The problem is that even though the outages' frequency decreased, they still happened.
Long story short: now the thing crashing my server was... NetData.
When I first set it up, I saw CPU usage spikes firmly in the "monitoring should not do this". Up to 30% of CPU. So I've been wary and set CPU limits in the docker-compose file.
But after yet another crash, I found out that now NetData is using up the entire memory.
That's when I decided it was not worth the effort, and just removed it. Maybe I could have placed more limiters on it or installed it outside Docker in the hopes of improving the perf, but fortunately, I don't need monitoring that badly. And if I needed it again - the compose file is still there, I could just spin it up again.
Here's to hoping I won't need to. 🤞🏻

Comments ()